Technical Indicators Predict Tough Times Ahead for XRP
Ranked sixth, the cross-border payments token remains stagnant amid a mostly bullish crypto market
March 31, 2024 06:50 AM
Reading time: 1 minute, 34 seconds
TL;DR Ripple's XRP struggles to catch the bullish wave, trailing behind in the cryptocurrency market rally led by Bitcoin. Key technical indicators, including the Parabolic SAR and MACD, hint at a potential further decline, despite the market's overall positive performance.

Despite the cryptocurrency market experiencing a significant upsurge in the last week, with Bitcoin [BTC] leading the charge past the $70,000 mark, Ripple's native token XRP has remained relatively stagnant.
According to CoinGecko, the global cryptocurrency market capitalization has seen an 8% increase, reaching $2.8 trillion. However, XRP's performance has been underwhelming, with only a 1% increase in its value over the same period, trading at $0.62 at the time of writing.
Key Technical Indicators Raise Concerns
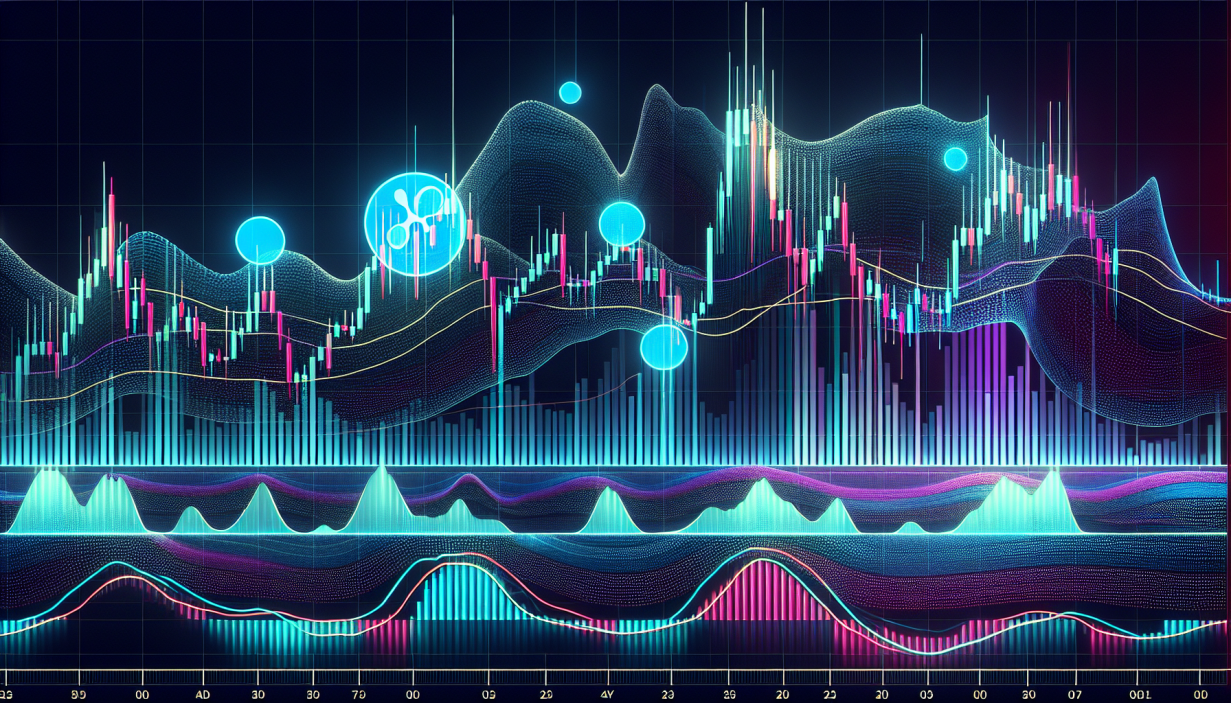
A closer look at XRP's price movements on a 1-day chart reveals worrying signs. The Parabolic SAR indicator, a tool used by traders to gauge potential reversals in an asset's price direction, shows dots positioned above XRP's price.
This placement suggests a bearish trend, indicating that the altcoin's price decline may persist. Furthermore, XRP's Moving Average Convergence Divergence (MACD) line has dipped below the signal line, reinforcing the bearish outlook. The MACD line's intersection with the signal line on 16th March marked the commencement of a bear cycle, leading to a nearly 10% drop in XRP's value.
In addition to these indicators, the Elder-Ray Index, which measures the market's buying and selling strength, has been significantly negative. This suggests that selling activity among market participants has been more pronounced than buying, further contributing to the price's downward trajectory.
Implications on the Derivatives Market
XRP's lackluster performance is also reflected in the derivatives market, where its Futures Open Interest has seen a slight decrease of 0.3% since 13th March. This indicates a reduction in market participation, as traders close contracts to mitigate losses.
"XRP's price rested below its Parabolic SAR indicator at the time of writing, signaling a bearish market trend."
Despite the broader market's optimistic tone, XRP's struggle to rally alongside its peers raises questions about its immediate future. Investors and traders will need to keep a close eye on these technical indicators for signs of a potential turnaround or further decline.


